A peer-reviewed, multi-clinic study published in the Journal of Assisted Reproduction and Genetics suggests an epigenetic sperm-quality profile can add missing information for infertile couples and clinicians, especially when they are considering IUI (Intrauterine Insemination), IVF (In Vitro Insemination), and/or ICSI (Intracytoplasmic Sperm Injection).
Path Fertility’s review of this capstone research, including the data gathered from preceding studies, confirms clinical data show that “up to 25% of men with a ‘normal’ Semen Analysis result have sperm that are incapable of producing a healthy pregnancy without intervention via advanced fertility techniques.”
SALT LAKE CITY, UT / ACCESS Newswire / March 10, 2026 / A newly published, peer-reviewed study adds real-world evidence that some couples are stuck in “fertility limbo” even after a Semen Analysis comes back “normal.”
According to Andy Olson, CEO and Co-Founder of Path FertilityTM, while it’s obvious that traditional Semen Analysis testing is a crucial first step for understanding sperm viability, for many infertile couples, Semen Analysis alone is not enough.
“This new study reinforces what so many couples experience firsthand: ‘normal’ Semen Analysis test results don’t always come with answers,” Olson said. “In fact, our review of the clinical data shows that up to 25% of men with a ‘normal’ Semen Analysis result have sperm that are incapable of producing a healthy pregnancy without intervention via advanced fertility techniques.
“When couples are stuck in such fertility limbo, they deserve better information sooner. Peer-reviewed, real-world evidence like that shown in this JARG report (and data gathered from prior studies), can help patients and clinicians have a more informed conversation about what to try next and what expectations are realistic.”
PHOTO CAPTION: Andy Olson, CEO and Co-Founder of Path Fertility. March 2026.
What the JARG Study Found
The JARG study analyzed outcomes from 537 couples treated at 10 U.S. fertility clinics and reported a clear pattern: when men had an Abnormal result on an epigenetic sperm test, no pregnancies were recorded from Intrauterine Insemination (IUI) in the outcomes captured in this real-world dataset. {NOTE: Epigenetics is a DNA-level method for scientists to study how cells turn genes on and off, including within sperm cells.}
By contrast, outcomes for in-vitro fertilization (IVF) using Intracytoplasmic Sperm Injection (ICSI) did not show a meaningful difference based on the epigenetic result.
A Quick Translation of the Treatments Mentioned in the Study
To understand why these findings matter, it can help to understand the difference between common fertility treatments. For example,
IUI (intrauterine insemination) is a procedure in which sperm is placed into the uterus around the time of ovulation. It is often tried early by couples attempting to overcome fertility challenges because it is less invasive and less costly than IVF;
IVF (in vitro fertilization) is a process where eggs are retrieved and fertilized in a lab; and
ICSI (intracytoplasmic sperm injection) is a common IVF technique where a highly trained IVF lab embryologist injects a single sperm into an egg to help fertilization occur.
What Semen Analysis Can Show and What it Cannot
Within the medical community, a Semen Analysis test is considered the “Standard of Care” in the field of infertility when it comes to identifying how many sperm are present in a semen sample, how they look, and how they move.
But a Semen Analysis test does not answer the question most infertile couples care about the most: Can these sperm do the job needed to create a pregnancy, especially with a treatment like IUI?
In reality, some sperm can look “normal” with a Semen Analysis test, but still struggle with the key functions required for conception: finding the egg, binding to the egg, penetrating the egg, and fertilizing the egg.
What the Newer Test Looks at, in Plain English
The new JARG study focuses on a still new sperm test based on epigenetics that measures chemical markers that help control how genes behave and how well sperm are likely to function.
SpermQT™, the new sperm-DNA test offered by Path Fertility, is designed to complement Semen Analysis testing by providing this additional epigenetics information about sperm quality and function.
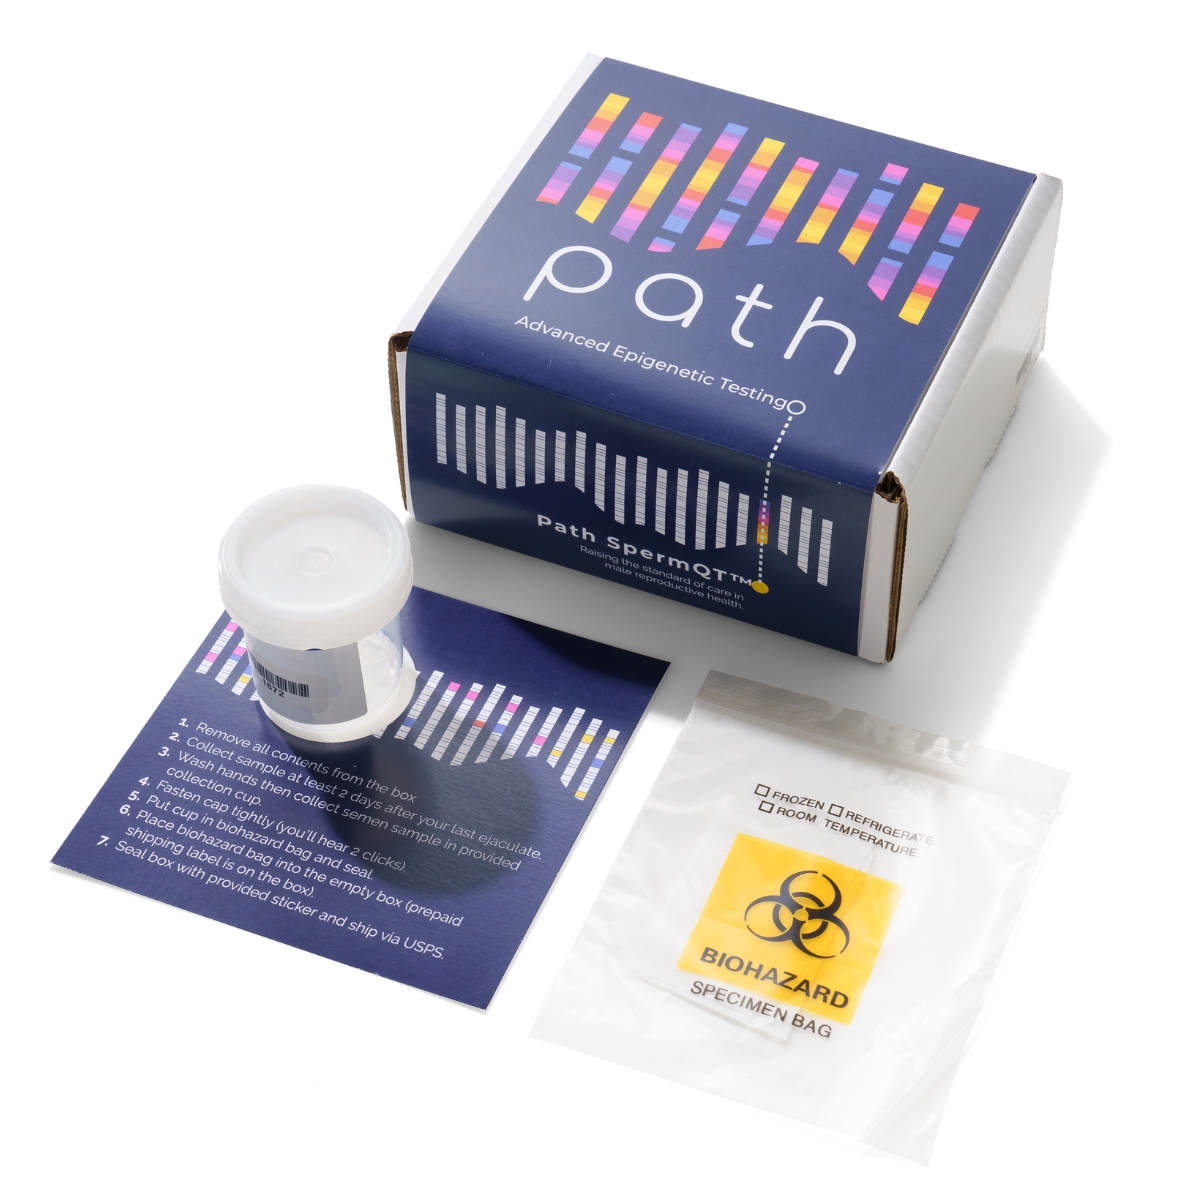
PHOTO CAPTION: The at-home version of SpermQT, a newsperm-DNA test offered by Path Fertility. March 2026
Why this New JARG Study Matters Now
What makes this JARG paper important is that it reports real-world outcomes across 10 clinics, based on anonymous patient data.
Specifically, the JARG study showed that for IUI outcomes, “Abnormal” epigenetic sperm results resulted in zero recorded IUI pregnancies among the couples in the JARG dataset. Conversely, in IVF cases that used ICSI, outcomes did not differ significantly based on the epigenetics result.
For mainstream readers, the takeaway is straightforward: a “normal” Semen Analysis test result is not always the end of the male-fertility conversation.
VIDEO CAPTION: SpermQT introductory video posted on YouTube (https://www.youtube.com/watch?v=EHvFUEBctTs). SpermQT is a new sperm-DNA test offered by Path Fertility.
In fact, additional sperm-focused information may help couples and clinicians set better expectations earlier, especially when deciding whether to keep trying IUI or to move more quickly to more advanced fertility techniques like IVF and/or ICSI.
How Prior Scientific Studies Led to this “Capstone” Result with JARG
This JARG report builds on two peer-reviewed research studies published in 2023, starting with a July 2023 study in Frontiers in Genetics. This data validated the broader scientific approach behind the testing available with SpermQT.
It also found that sperm epigenetic variability was linked with pregnancy and live birth outcomes for IUI, while IVF outcomes did not show a similar separation.
Additionally, a November 2023 study in F&S Science reported that adding epigenetic sperm information could improve how well an analysis of sperm predicted IUI outcomes. This same study reported that IVF outcomes, largely using ICSI, did not show the same differences across epigenetic sperm quality groups.
Together, the 2023 findings laid the scientific groundwork for a greater understanding of sperm viability for infertile couples, while the new JARG paper extended that work into a larger, multi-clinic, real-world setting.
A Perspective from the Clinic
“Many couples hear that the Semen Analysis results are ‘normal’ and assume the male side has been cleared,” said Kaylen Silverberg, MD, Medical Director and fertility specialist with Texas Fertility Center. “However, the type of peer-reviewed research in this JARG study supports a more comprehensive evaluation of male fertility, just as we do with our female patients. SpermQT test results enable couples to make decisions with clearer expectations, especially when considering whether to pursue repeated IUI cycles or proceed to IVF with ICSI.”
A Comment from Path’s Scientific Leadership
“Clinicians and couples alike should think of the data provided by SpermQT results as another piece of the puzzle,” said Kristin Brogaard, Ph.D., Co-Founder and Chief Science Officer of Path Fertility, and a co-author of the JARG study. “Clearly, traditional Semen Analysis testing is still the ‘Standard of Care’ in fertility circles. However, this new test provides a deeper level of detail about sperm function that standard testing does not measure directly, and this additional information can be invaluable to couples struggling with infertility.”
PHOTO CAPTION: Kristin Brogaard, Ph.D., Chief Science Officer and Co-Founder pf Path Fertility. March 2026.
Responsible Interpretation
This new study in JARG reports real-world associations across clinics and treatments, but it does not tell any individual couple what they should do. Patients should discuss testing and treatment options with a qualified clinician who can consider the full medical picture of both partners.
PHOTO CAPTION: SpermQT Test Results Overview Page from Path Fertility. March 2026
About Path Fertility and SpermQT
Path Fertility is focused on raising the “Standard of Care” in male fertility by providing deeper insight into sperm quality and function. As such, SpermQT is a sperm quality test based on epigenetic DNA-markers and is designed to complement Semen Analysis by adding new information related to sperm function.
NOTE: Published Studies Referenced in this Release
SALT LAKE CITY, UT / ACCESS Newswire / March 10, 2026 / Path FertilityTM, an epigenetics-driven fertility technology company, today unveiled the Path Fertility Facts Sheet, a copy of which is embedded below within this news release.
BEGINNING OF THE Path FertilityTM Facts Sheet
Overview
Path FertilityTM helps clinicians and patients uncover male-factor insights that can be missed by “Standard-of-Care” Semen Analysis testing alone, so couples can make more informed fertility treatment decisions sooner.
Path Fertility offers clinically validated testing that evaluates sperm quality and function using epigenetics, providing additional insight into reproductive potential and likely success with common fertility treatment pathways.
Such insights are now validated through three separate, peer-reviewed studies published, respectively, by
The Journal of Assisted Reproduction and Genetics (JARG), 2026;
F&S Science, 2023; and
Frontiers in Genetics, 2023.
Details noted below.
Why this Matters
In fertility care, the male partner is too often “cleared” based on a Semen Analysis result that falls into a reference range. But “Normal” test results do not always mean normal sperm function.
Path Fertility exists to help close that information gap earlier, helping couples reduce avoidable time, cost, and emotional strain.
Flagship Test: SpermQT™
SpermQT™ is a clinically validated epigenetic sperm quality test designed to help predict the likelihood of pregnancy success with certain fertility treatment pathways, especially Intrauterine Insemination (IUI), a procedure where sperm are placed directly into the uterus during ovulation.
VIDEO CAPTION: The “SpermQT vs. Standard Semen Analysis: What’s the Difference?” video from Path Fertility. Video available on YouTube here (https://www.youtube.com/watch?v=nQDm7hngzBk).
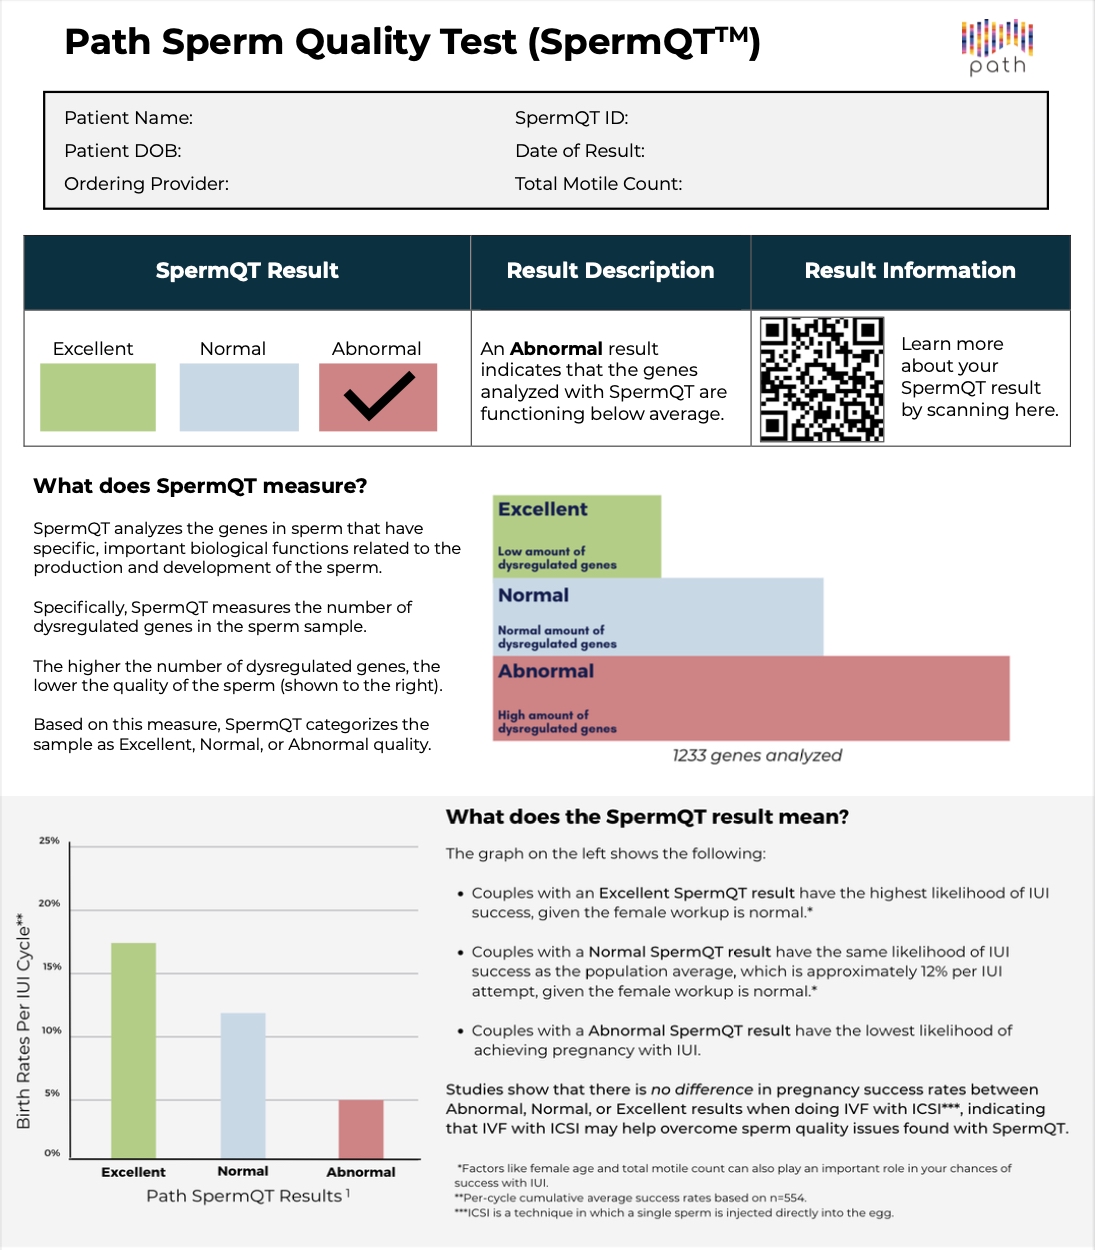
What SpermQT Measures
DNA methylation patterns associated with sperm quality and function, i.e., the presence of certain DNA abnormalities in sperm
Functional capability associated with sperm’s ability to find, bind, penetrate, and fertilize
DNA methylation dysregulation across 1,200+ genes
Results are reported as
Excellent,
Normal, and
Abnormal.
Key Clinical Insights
Review of the clinical data shows that SpermQT results are associated with meaningful differences in pregnancy outcomes for couples pursuing IUI.
SpermQT can identify subfertile men who may be missed by Semen Analysis alone; case in point, 4 out of 5 men with an Abnormal SpermQT result receive a “Normal” test result via Semen Analysis testing.
Either In Vitro Fertilization (IVF), where eggs are fertilized in a lab, or with Intracytoplasmic Sperm Injection (ICSI), where a single sperm is injected into an egg, may help overcome certain sperm quality challenges observed in epigenetic testing.
PHOTO CAPTION: SpermQT overview page from Path Fertility. March 2026
Who can Benefit
Patients / Couples
Couples exploring treatment options and wanting better clarity before choosing a path,
Couples with “unexplained infertility,” including cases with “Normal” Semen Analysis results, and
Couples with failed IUI cycles that need better decision support on next steps.
Providers
Fertility clinics and reproductive endocrinology teams seeking better early male-factor insights,
Urology and andrology practices aiming to improve male workup resolution, and
Clinics seeking stronger prediction support for IUI planning and counseling.
When to use SpermQT
SpermQT is designed as a complement to, and not a replacement of, “Standard-of-Care” Semen Analysis. It is often most useful:
Early in the initial male fertility workup, alongside Semen Analysis,
When Semen Analysis is “Normal” but pregnancy has not occurred as expected, and
After failed IUI attempts to inform whether to continue IUI or move to IVF, with or without ICSI.
How it Works
Physician-ordered test (ordering support available through Path Fertility),
Sample collected via at-home kit (or clinic workflow when applicable),
Testing performed; results returned in about 2 weeks, and
Provider reviews results with the patient to inform next-step planning.
END OF THE Path Fertility Fact Sheet AND COMPLETION OF THE NEWS RELEASE BELOW
About Path Fertility and SpermQT
Path Fertility is focused on raising the “Standard of Care” in male fertility by providing deeper insight into sperm quality and function. As such, SpermQT is a sperm quality test based on epigenetic DNA-markers and is designed to complement Semen Analysis by adding new information related to sperm function.
Path Fertility, SpermQT, and the Path Fertility logos are trademarks of Inherent Biosciences, Inc. All other trademarks are property of their respective owners.
Driving Intelligent Business Operations Through an AI-Enabled BPM Model
LEXINGTON, KY / ACCESS Newswire / March 10, 2026 / Helpware announced a major transformation and repositioning as an AI-enabled Business Process Management (BPM) company, unveiling a refreshed brand identity, including a new logo and website, alongside an organizational realignment.
Since its foundation in 2015, Helpware has built a reputation as a trusted partner delivering high-quality customer experience solutions for startups, mid-sized businesses, and global enterprises. Yet the outsourcing landscape is evolving rapidly, driven by digital acceleration, artificial intelligence, and changing customer expectations. Against this backdrop, Helpware recognized the imperative of structural transformation.
From Outsourcing Partner to BPM Innovator
Moving beyond its traditional stronghold of delivering world-class outsourcing services, Helpware has evolved into a strategic AI-enabled BPM partner that designs and orchestrates an entire operational ecosystem combining advanced analytics, AI automation, and human insight to reshape how CX functions at scale. This empowers businesses to achieve greater agility, consistency, and resilience they need to thrive in new market realities.
To reflect this shift, Helpware has restructured into four focused divisions:
Helpware CX shapes AI-powered, human-centered customer experiences that strengthen relationships, improve retention, and build brand trust.
Helpware AI powers intelligent automation across people, processes, and platforms through the integration of customizable AI modules and high-quality training data.
Helpware Tech builds advanced software and technology solutions that streamline operations, drive efficiency, and enable scalability.
Helpware Media drives data-informed marketing strategies and creative campaigns that accelerate brand visibility and enable sustainable growth.
By aligning these four divisions within the BPM model, Helpware provides an end-to-end operational partnership spanning engineering, AI, marketing, and customer operations, forming an integrated ecosystem that delivers solutions across the full lifecycle, from strategy and consulting through implementation, delivery, and ongoing optimization.
Strengthening Leadership with Nanette Harrell
As part of this transformation, Nanette Harrell has been appointed President of Helpware. In this role, she will assume responsibility for IT, Operations, and Human Resources, and drive AI strategy and enablement. This alignment ensures tight integration between technology development and operational excellence, empowering teams to deliver the next generation of intelligent service offerings.
Nanette Harrell brings more than 20 years of leadership experience in technology and operations. She previously held senior roles at GE and Railinc, where she spearheaded large-scale transformations that streamlined processes and elevated customer satisfaction. Her appointment signals Helpware’s commitment to strengthening its leadership bench with executives who combine technical depth, operational expertise, and a people-first philosophy.
Nanette shared her perspective on joining Helpware at this pivotal moment:
“What drew me to Helpware is its clear conviction that people remain at the heart of business, even in an era increasingly defined by AI. I believe in the power of blending advanced technology with human potential to deliver extraordinary results. My focus at Helpware will be to help clients design customer experiences that are intelligent, adaptive, and deeply human. We will use AI to anticipate needs and automate routine tasks, while empowering people to build trust, solve complex problems, and connect with customers in ways machines cannot. It’s this balance-AI plus people-that will define the future of customer experience.”
Refreshed Brand Identity and Digital Presence
As part of its transformation into a global BPM leader, Helpware has refreshed its brand identity with a bold new logo and redesigned website. The new design introduces strong typography and a modern, confident aesthetic. Paired with a streamlined, user-friendly website, the refreshed brand identity reflects both continuity with its people-first roots and a forward-looking vision for intelligent growth.
A Vision for the Future
Robert Nash, Helpware Chief Executive Officer, describes the transformation as both a natural evolution and a bold step forward:
“When we started Helpware ten years ago, our vision was simple but powerful: to revolutionize traditional outsourcing by putting people at the center. That vision hasn’t changed, but the tools available to us have. Artificial intelligence is reshaping how businesses operate, yet it cannot replace human insight, empathy, and creativity. Our new AI-enabled BPM positioning aims to unite these two forces. With AI providing speed, scale, and predictive power, and people bringing context, problem-solving, and emotional intelligence, we are creating a new model for how businesses can thrive.”
This transformation sets the company on a trajectory for continued growth. Helpware plans to continue investing in AI research and development, building partnerships with leading technology providers, and expanding its global delivery footprint. At the same time, the company remains committed to its people-first values, ensuring that as technology advances, the human element remains central.
The new Helpware identity fully reflects its vision: A model where advanced technological innovations and human expertise work in harmony offers boundless opportunities to achieve greater impact.
IRVINE, CA / ACCESS Newswire / March 10, 2026 / Allied Universal®, the world’s leading security and facility services company, today announced it is hiring staff for the world’s premier soccer event at Lumen Field in Seattle. See hiring event details below.
WHAT: Allied Universal®, North America’s leading security and facility services company, is filling 1000 event staff positions to work at a premier global soccer tournament at Lumen Field in Seattle, Washington. Available positions include ushers, access control, crowd management and more.
QUOTE: “Allied Universal offers careers and long-term growth in the thriving and essential security industry,” said Steve Jones, global chairman and CEO of Allied Universal. “We have countless examples of individuals who began their career as a security professional and are in senior leadership positions today.”
Allied Universal offers great benefits for full-time team members. There are various job sites and positions available including customer service officers, security mobile patrol officers, emergency department officers, security shift supervisors, security dispatch operators and more.
For full-time positions, company benefits include medical and dental coverage, life insurance, 401(k), holidays and more. At Allied Universal, our Culture & Belonging approach fosters an environment where every team member – no matter their background or experience – feels valued, included, and aligned with our core values. We are a workforce built on teamwork, collaboration, and mutual respect. If you’re looking for a meaningful opportunity in a supportive and collaborative workplace, we invite you to apply at jobs.aus.com. To learn more about our Equal Employment Opportunity and ADA policies, click here.
About Allied Universal The world’s leading security and facility services provider and trusted partner to more than 400 of the Fortune 500, Allied Universal® delivers unparalleled customer relationships, innovative solutions, cutting-edge smart technologies and tailored services that enable clients to focus on their core businesses. With operations in over 100 countries and territories, Allied Universal is the third largest private employer in North America and seventh in the world. Annual revenue is approximately $23 billion. There is no greater purpose and responsibility than serving and helping to safeguard customers, communities and people. For more information, visit www.aus.com.
# # #
Media Contact: Kari Garcia Director of Communications – North America Allied Universal Phone: 949-826-3560 Email: Kari.Garcia@aus.com Newsroom: ausnewsroom@aus.com
Dr. Raza Bokhari, Executive Chairman & CEO will participate in panel discussions and highlight Company’s AI-enabled Drug Development Strategy
PHILADELPHIA, PA / ACCESS Newswire / March 10, 2026 / Medicus Pharma Ltd. (NASDAQ:MDCX) (“Medicus” or the “Company”), a biotech/life sciences company focused on advancing the clinical development programs of novel and potentially disruptive therapeutics assets, is pleased to announce its participation in the Longwood Miami CEO forum being held March 11-13, 2026, at the Ritz-Carlton Key Biscayne.
Dr. Raza Bokhari, Executive Chairman & CEO of Medicus, will serve on a panel titled “Accelerating the Path to Patient Care” and will highlight company’s AI enabled Drug development strategy designed to make clinical trials not only cost efficient but also time efficient.
Other panelists include Lindsay Edwards, CTO & President of Platform, Relation Therapeutics; Julie Gerberding, CEO, Foundation for the NIH and Former Director, CDC; and Gilmore O’Neill, CEO, Editas Medicine. The panel will be moderated by Jon Cohen, Head of Life Sciences Go-To-Market at ServiceNow.
Longwood Miami CEO is an invitation-only event, that brings together Industry leaders, innovators, thought leaders and opinion makers, who will speak on curated fireside chats, roundtables, and discussion panels.
Notable Participants in the conference include Brent Saunders (CEO, Bausch + Lomb), Chris Boshoff (CSO & President, R&D, Pfizer), Rob Califf (former Commissioner, FDA), Sidney Taurel (Chair Emeritus, Lilly), Bill Mezzanotte (Head, R&D, CSL), David Redfern (President, Corporate Development, GSK), Pablo Cagnoni (Head, R&D, Incyte), Julie Gerberding (former Director, CDC), Bill Hait (Chief Scientific Advisor, AACR; former CMO, J&J), Jeremy Levin (Chair & CEO, Ovid Therapeutics), David Meek (former CEO, Ipsen; CEO, Genetix), Frank Nestle (CEO, Deerfield Discovery), Benj Garrett (Managing Director, Stifel), among others.
Medicus Pharma Ltd. (Nasdaq:MDCX) is a precision-guided biotech/life sciences company focused on accelerating the clinical development programs of novel and potentially disruptive therapeutics assets. The Company is actively engaged in multiple countries across three continents.
SkinJect Inc., a wholly owned subsidiary of Medicus Pharma Ltd., is a development-stage life sciences company focused on commercializing a novel, non-invasive treatment for basal cell skin cancer using a patented dissolvable microneedle patch to deliver a chemotherapeutic agent to eradicate tumor cells.
In August 2025, the Company announced its entry into a non-binding memorandum of understanding (MoU) with Helix Nanotechnologies, Inc. (HelixNano), a Boston-based biotech company focused on developing a proprietary advanced mRNA platform, in respect of their shared mutual interest in the development or commercial arrangement contemplated by the MoU. The MoU is non-binding and shall not be construed to obligate either party to proceed with a joint venture or any further development or commercial arrangement, unless and until definitive agreements are executed.
In August 2025, the Company completed the acquisition of Antev, a UK-based late clinical stage biotech company, developing Teverelix, a next-generation gonadotrophin-releasing hormone (GnRH) antagonist, as a first-in-market product for cardiovascular high-risk advanced prostate cancer patients and patients with first acute urinary retention relapse (AURr) episodes due to enlarged prostate.
Unlike GnRH agonists, which can cause an initial surge in testosterone levels, Teverelix directly suppresses sex hormone production without this surge, potentially reducing cardiovascular risks. This mechanism is particularly beneficial for patients with existing cardiovascular conditions. Teverelix is formulated as a microcrystalline suspension, allowing for sustained release and a six-week dosing interval, which may improve patient compliance and outcomes.
In October 2025, the Company announced a strategic collaboration with the Gorlin Syndrome Alliance (GSA) to advance compassionate access to SkinJect for patients suffering from Gorlin Syndrome, also known as nevoid basal cell carcinoma syndrome.
Under the collaboration, Medicus and the GSA will jointly pursue the Expanded Access IND Program with the FDA to allow patients with multiple, recurrent, or inoperable basal cell carcinomas (BCCs) to access SkinJect under physician-supervised treatment protocols. The initiative aims to establish a framework for expanded access while collecting valuable real-world safety and tolerability data to inform future regulatory filings. It will also more tightly integrate patient community-led insights and data into the design, monitoring, and long-term development of SkinJect in this rare disease population.
In November 2025, the Company received full regulatory and ethical approvals in the United Kingdom to expand its ongoing Phase 2 clinical study (SKNJCT-003) evaluating D-MNA to non-invasively treat BCC of the skin. The approvals were issued by the Medicines and Healthcare products Regulatory Agency (MHRA), the Health Research Authority (HRA) and the Wales Research Ethics Committee (WREC). The MHRA approval followed a comprehensive scientific review of the Investigational Medicinal Product Dossier (IMPD) and protocol. The WREC issued a favorable ethical opinion, and the HRA granted study-wide governance approval, confirming compliance with UK Good Clinical Practice and National Health Service capacity and capability standards.
In December 2025, the Company announced that it has successfully completed enrolment of 90 patients in the United States for Phase 2 clinical study (SKNJCT-003) evaluating D-MNA to non-invasively treat BCC of the skin. The Company expects to secure an end-of-Phase 2 meeting with the FDA in the first half of 2026.
In December 2025, Medicus announced a non-binding letter of intent with Reliant AI Inc., a decision-intelligence company specializing in generative AI for the life sciences industry, to collaborate on the development of an AI-driven clinical data analytics platform. Subject to execution of definitive agreements, the platform is expected to support capital-efficient clinical development through data-driven dynamic clinical-site selection, patient stratification and enrollment forecasting. The initial phase of the collaboration is expected to support an upcoming Teverelix clinical study planned for 2026, with potential expansion into later-stage development programs in collaboration with a strategic partner.
In February 2026, the Company announced that it has received “study may proceed” clearance from the U.S. Food and Drug Administration (FDA) to initiate its Phase 2b dose-optimization study of Teverelix®, an investigational next generation long-acting GnRH antagonist, in men with advanced prostate cancer (APC).
Cautionary Notice on Forward-Looking Statements
Certain information in this news release constitutes “forward-looking information” under applicable securities laws. “Forward-looking information” is defined as disclosure regarding possible events, conditions or financial performance that is based on assumptions about future economic conditions and courses of action and includes, without limitation, statements regarding the Company’s leadership and prospects, the collaboration with GSA including the potential benefits thereof for GSA, those suffering with Gorlin Syndrome and Medicus (including as it relates to the development of SkinJect™), ability to be approved for the Expanded Access IND Program to enable those suffering with Gorlin Syndrome to access SkinJect™ under physician-supervised treatment protocols, the development of Teverelix and expectations concerning, and future outcomes relating to, the development, advancement and commercialization of Teverelix for AURr, high CV risk prostate cancer, women’s health indications like endometriosis, and the potential market opportunities related thereto, the MOU, including the potential signing of definitive agreements between Medicus and HelixNano and the development of thermostable infectious diseases vaccines by combining HelixNano’s proprietary mRNA vaccine platform with Medicus’s proprietary microneedle array (MNA) delivery platform, the Company’s aim to fast-track the clinical development program and convert the SKNJCT-003 exploratory clinical trial into a pivotal clinical trial, and approval from the FDA and the timing thereof, including with respect to the Company’s submission for approval in the FDA Commissioner’s National Priority Voucher program, plans and expectations concerning, and future outcomes relating to, the development, advancement and commercialization of SkinJect through SKNJCT-003 and SKNJCT-004, and the potential market opportunities related thereto, the Company’s expectations regarding reported efficacy findings and whether there will be material changes to its reported SKNJCT-003 topline results and to secure an EOP2 meeting with the FDA in the first half of 2026, entry into definitive documents with Reliant and the expected terms thereof, engaging in proposed Medicus-sponsored studies currently contemplated in the Reliant non-binding letter of intent and the expected benefits thereof, the expansion of SKNJCT-003 into the United Kingdom and the potential benefits therefrom, the advancement of the SKNJCT-004 study and the potential results of and benefits of such study. Forward-looking statements are often but not always, identified by the use of such terms as “may”, “on track”, “aim”, “might”, “will”, “will likely result”, “could,” “designed,” “would”, “should”, “estimate”, “plan”, “project”, “forecast”, “intend”, “expect”, “anticipate”, “believe”, “seek”, “continue”, “target”, “potential” or the negative and/or inverse of such terms or other similar expressions. These statements involve known and unknown risks, uncertainties and other factors, which may cause actual results, performance or achievements to differ materially from those expressed or implied by such statements, including those risk factors described in the Company’s annual report on form 10-K for the year ended December 31, 2024 (the “Annual Report”), and in the Company’s other public filings on EDGAR and SEDAR+, which may impact, among other things, the trading price and liquidity of the Company’s common shares. Forward-looking statements contained in this news release are expressly qualified by this cautionary statement and reflect our expectations as of the date hereof and thus are subject to change thereafter. The Company disclaims any intention or obligation to update or revise any forward-looking statements, whether as a result of new information, future events or otherwise, except as required by law. Readers are further cautioned not to place undue reliance on forward-looking statements as there can be no assurance that the plans, intentions or expectations upon which they are placed will occur. Such information, although considered reasonable by management at the time of preparation, may prove to be incorrect and actual results may differ materially from those anticipated.
FY25 EPS of $0.08; FY25 Adjusted EPS growth of 5% to $0.83
YoY Increase in Cash Flow from Operations of $148 million; Free Cash Flow more than doubled to $187 million
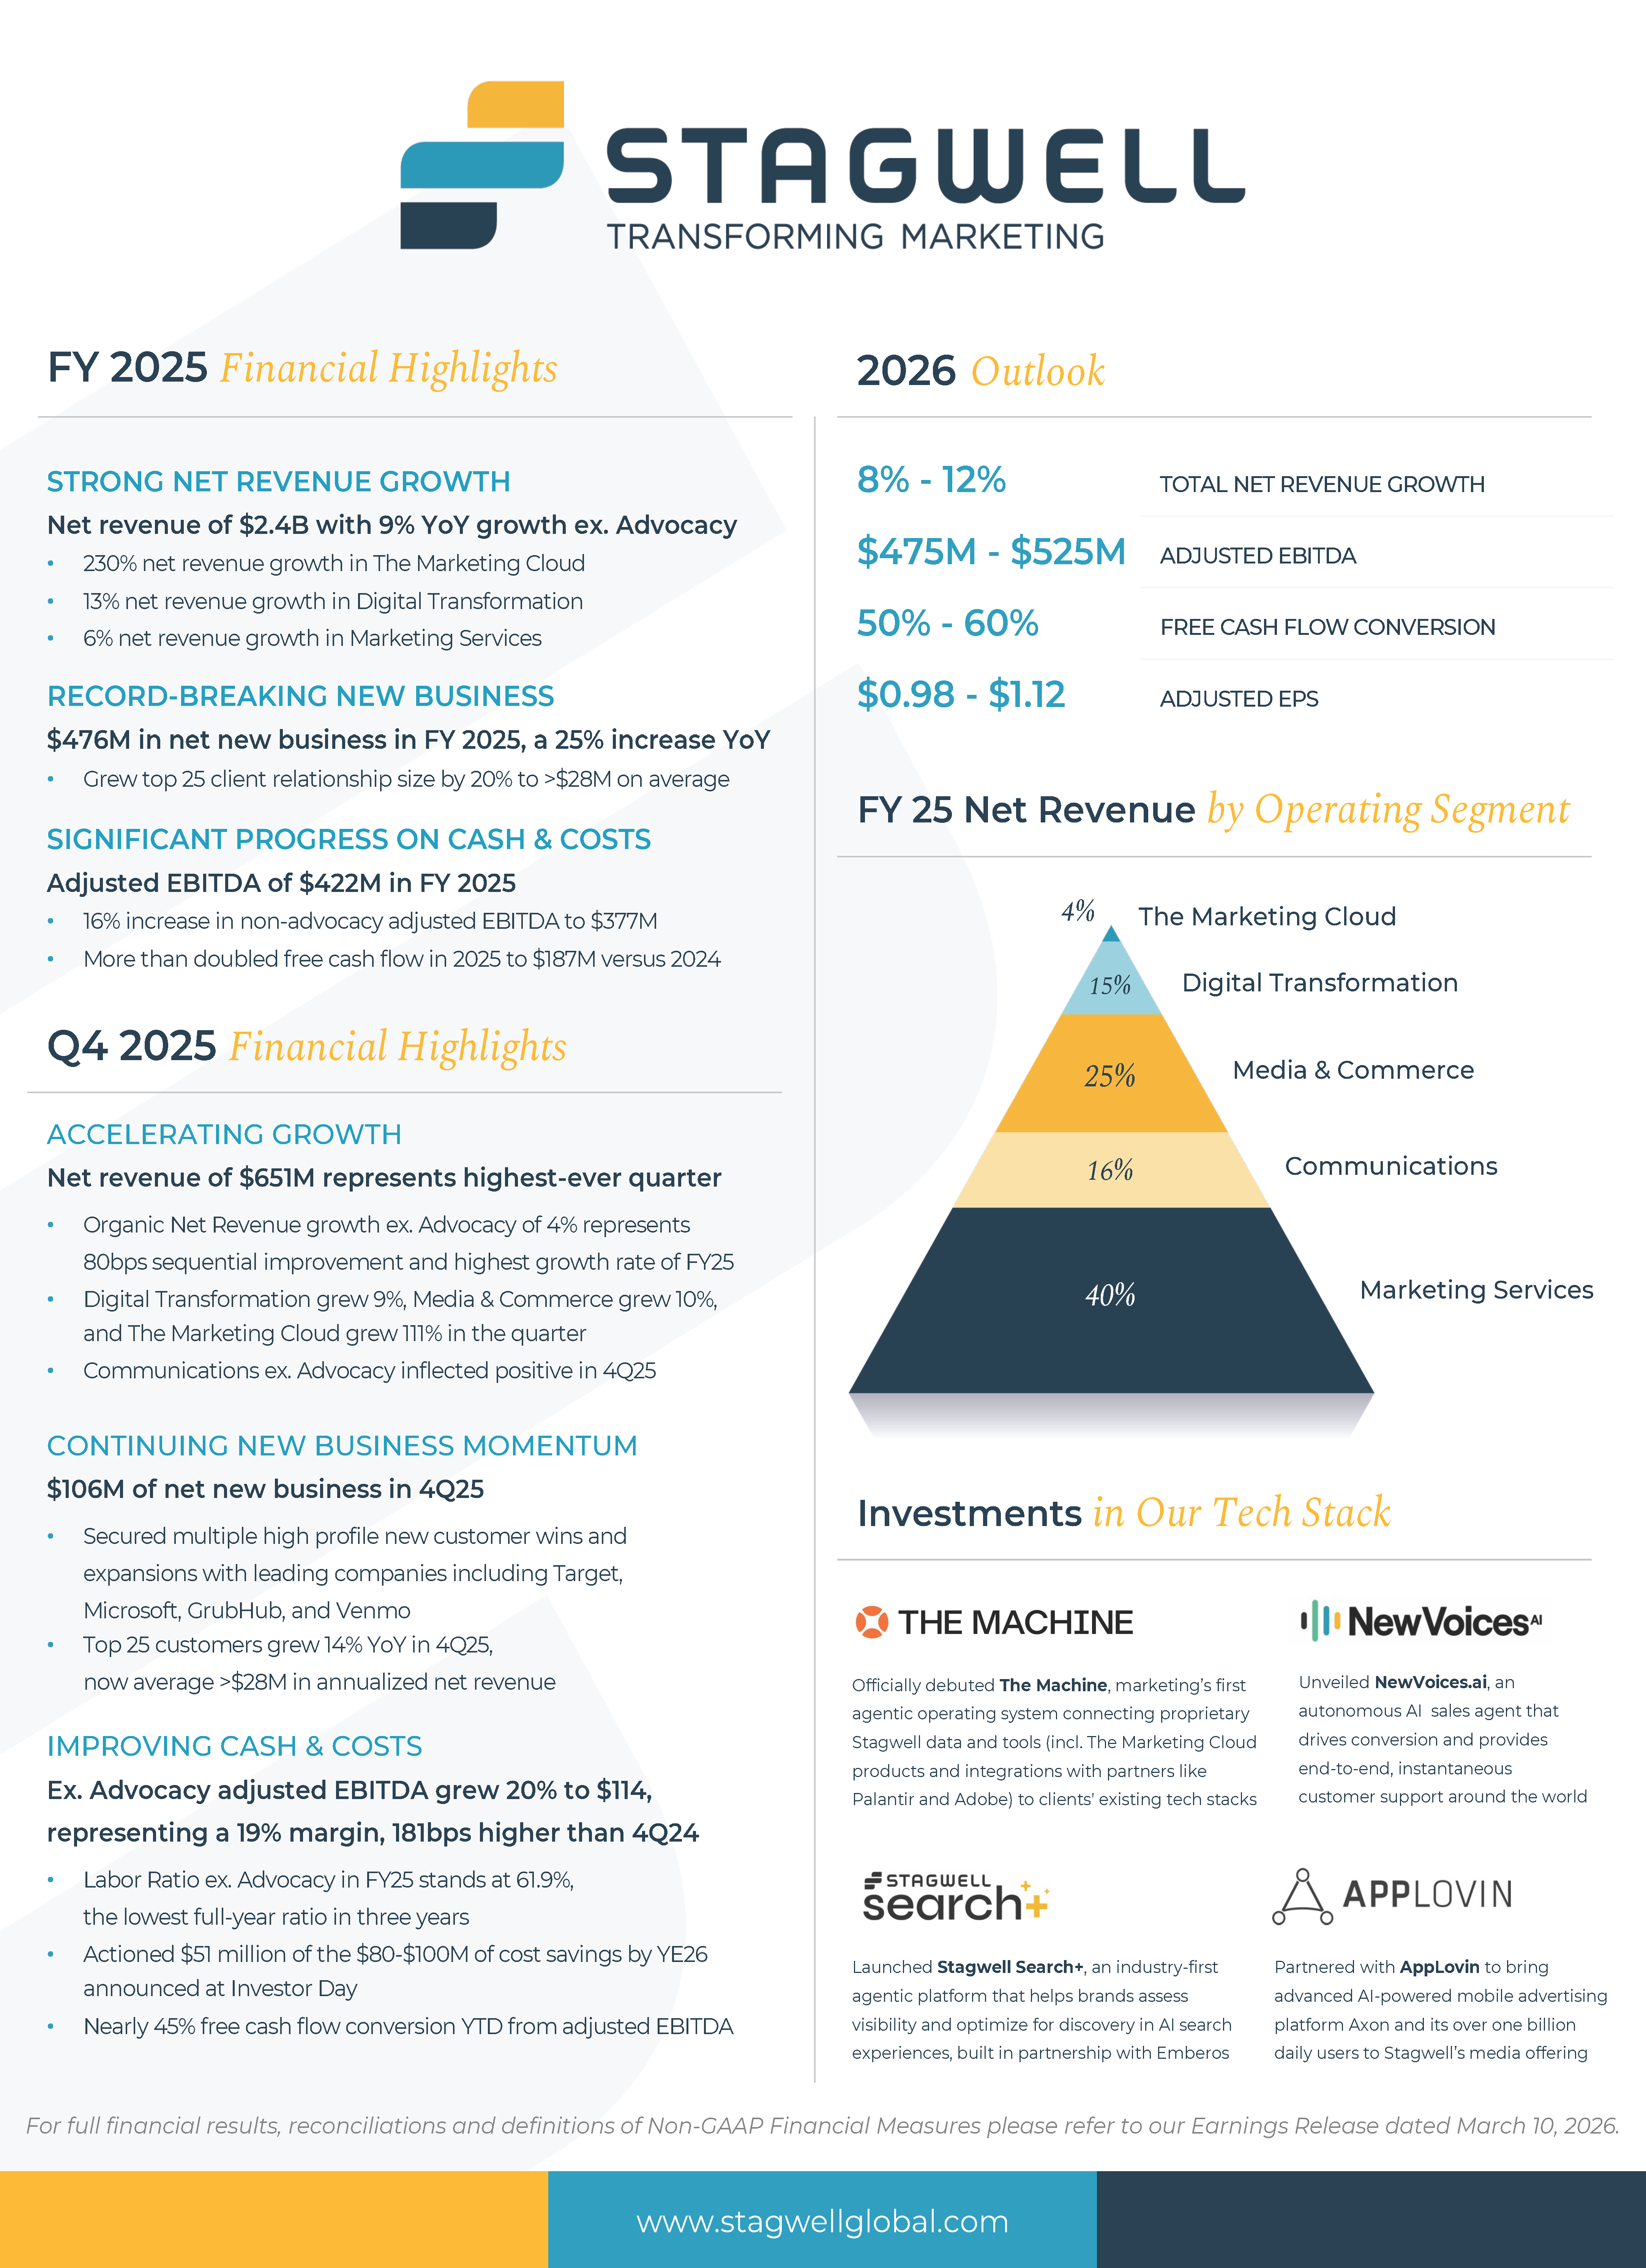
FY25 YoY Revenue Growth of 2%; FY25 YoY Net Revenue Growth of 6%
FY25 YoY Net Revenue Growth excluding Advocacy of 9%, Digital Transformation Net Revenue Growth of 13%, Marketing Services Net Revenue Growth of 6%
The Marketing Cloud delivered YoY Net Revenue Growth of 230%
FY25 Net Income Attributable to Stagwell Inc. Common Shareholders of $29 million; FY25 Adjusted EBITDA of $422 million; FY25 Adjusted EBITDA ex. Advocacy YoY Growth of 16% to $377 million
Net New Business of $106 million in Q4; LTM Net New Business of $476 million
Company Announces $350 Million Increase in Stock Repurchase Program; $400 Million Now Available Under the Program
Guidance for 2026 of Total Net Revenue Growth of 8% to 12%; Adjusted EBITDA of $475 million to $525 million; Free Cash Flow Conversion of 50% to 60%
NEW YORK CITY, NY / ACCESS Newswire / March 10, 2026 / (NASDAQ:STGW) – Stagwell Inc. (“Stagwell”) today announced financial results for the year ended December 31, 2025.
FOURTH QUARTER AND FULL YEAR RESULTS:
Q4 Revenue of $807 million, an increase of 2% versus the prior year period; FY25 Revenue of $2,909 million, an increase of 2% versus the prior year period;
Q4 Revenue ex. Advocacy of $742 million, an increase of 12% versus the prior year period; FY25 Revenue ex. Advocacy of $2,689 million, an increase of 9% versus the prior year period;
Q4 Net Revenue of $651 million, an increase of 3% versus the prior year period; FY25 Net Revenue of $2,428 million, an increase of 6% versus the prior year period;
Q4 Net Revenue ex. Advocacy of $609 million, an increase of 8% versus the prior year period; FY25 Net Revenue ex. Advocacy of $2,282 million, an increase of 9% versus the prior year period;
Q4 Net Income attributable to Stagwell Inc. Common Shareholders of $13 million versus $3 million in the prior year period; FY25 Net Income attributable to Stagwell Inc. Common Shareholders of $29 million versus $2 million in the prior year period;
Q4 Adjusted EBITDA of $129 million, an increase of 3% versus the prior year period; FY25 Adjusted EBITDA of $422 million, an increase of 1% versus the prior year period;
Q4 Adjusted EBITDA Margin of 20% on net revenue; FY25 Adjusted EBITDA Margin of 17% on net revenue;
Q4 Earnings Per Share Attributable to Stagwell Inc. Common Shareholders of $0.05 versus $0.03 in the prior year period; FY25 Earnings Per Share Attributable to Stagwell Inc. Common Shareholders of $0.08 versus $0.02 in the prior year period;
Q4 Adjusted Earnings Per Share attributable to Stagwell Inc. Common Shareholders of $0.30 versus $0.25 in the prior year period; FY25 Adjusted Earnings Per Share attributable to Stagwell Inc. Common Shareholders of $0.83 versus $0.79 in the prior year period;
YTD Net Cash provided by Operating Activities of $291 million versus $143 million in the prior year period;
Net new business of $106 million in the fourth quarter, last twelve-month net new business of $476 million
See “Non-GAAP Financial Measures” below for explanations and reconciliations of the Company’s non-GAAP financial measures.
“In 2025, Stagwell increased its strategic pivot toward AI applications and services, building a powerful foundation for 2026. With accelerating growth ex-advocacy, record net new business, expanding margins and doubled free cash flow, our FY25 results prove our strategy is working,” shared Mark Penn, Stagwell’s Chairman and CEO. “We see great opportunity in 2026 to capitalize on an industry distracted by restructurings and mergers, and bolster our position as a winner in the age of AI.”
Ryan Greene, Chief Financial Officer, commented: “2025 marked an inflection year for Stagwell, with clear momentum in the underlying business and improving efficiency contributing to strong year-over-year net revenue, adjusted EBITDA and adjusted EPS growth. Proactive cash management meant we more than doubled our free cash flow in 2025. We expect another strong year in 2026, and will be aggressive in our capital allocation to drive shareholder value.”
Financial Outlook
2026 financial guidance is as follows:
Total Net Revenue growth of 8% to 12%
Adjusted EBITDA of $475 million to $525 million
Free Cash Flow Conversion of 50% to 60%
Adjusted EPS of $0.98 – $1.12
Guidance includes anticipated impact from acquisitions or dispositions.
* The Company has excluded a quantitative reconciliation with respect to the Company’s 2026 guidance under the “unreasonable efforts” exception in Item 10(e)(1)(i)(B) of Regulation S-K. See “Non-GAAP Financial Measures” below for additional information.
Stock Repurchase Program
On March 4, 2026, the Board of Directors authorized an extension and a $350.0 million increase in the size of our previously approved stock repurchase program (the “Repurchase Program”). Under the Repurchase Program, as amended, we may repurchase up to an aggregate of $725.0 million of shares of our outstanding Class A common stock, par value $0.001 per share (“Class A Common Stock”), with any previous purchases under the Repurchase Program continuing to count against that limit. With the increase, we have a total of approximately $400.0 million available for repurchases. The Repurchase Program will expire on March 4, 2029.
Video Webcast
Management will host a video webcast on Tuesday, March 10, 2026, at 8:30 a.m. (ET) to discuss results for Stagwell Inc. for the year ended December 31, 2025. The video webcast will be accessible at https://edge.media-server.com/mmc/p/3x58p928/. An investor presentation has been posted on our website at www.stagwellglobal.com and may be referred to during the webcast.
A recording of the webcast will be accessible one hour after the webcast and available for ninety days at www.stagwellglobal.com.
Stagwell Inc.
Stagwell is the challenger network built to transform marketing. We deliver scaled creative performance for the world’s most ambitious brands, connecting culture-moving creativity with leading-edge technology to harmonize the art and science of marketing. Led by entrepreneurs, our specialists in 45+ countries are unified under a single purpose: to drive effectiveness and improve business results for their clients. Join us at www.stagwellglobal.com.
In addition to its reported results, Stagwell Inc. has included in this earnings release certain financial results that the Securities and Exchange Commission (SEC) defines as “non-GAAP Financial Measures.” Management believes that such non-GAAP financial measures, when read in conjunction with the Company’s reported results, can provide useful supplemental information for investors analyzing period to period comparisons of the Company’s results. Such non-GAAP financial measures include the following:
(1) Organic Net Revenue: “Organic net revenue growth” and “Organic net revenue decline” reflects the year-over-year change in the Company’s reported net revenue attributable to the Company’s management of the entities it owns. We calculate organic net revenue growth (decline) by subtracting the net impact of acquisitions (divestitures) and the impact of foreign currency exchange fluctuations from the aggregate year-over-year increase or decrease in the Company’s reported net revenue. The net impact of acquisitions (divestitures) reflects the year-over-year change in the Company’s reported net revenue attributable to the impact of all individual entities that were acquired or divested in the current and prior year. We calculate impact of an acquisition as follows: (a) for an entity acquired during the current year, we present the entity’s current period reported revenue as the impact of the acquisition in the current year; and (b) for an entity acquired in the prior year, we present an amount equal to the entity’s current year net revenue for the same period during which we didn’t own the entity in the prior year as the impact of the acquisition in the current year. We calculate impact of a divestiture as follows: (a) for a divestiture in the current year, we present the entity’s prior year net revenue for the same period during which we no longer owned it in the current year as impact of the divestiture in the current year; and (b) for a divestiture in the prior year, we present the entity’s prior year net revenue for the period during which we owned it in the prior year as impact of the divestiture in the current year. We calculate the impact of any acquisition or divestiture without adjusting for foreign currency exchange fluctuations. The impact of foreign currency exchange fluctuations reflects the year-over-year change in the Company’s reported net revenue attributable to changes in foreign currency exchange rates. We calculate the impact of foreign currency exchange fluctuations for the portion of the reporting period in which we recognized revenue from a foreign entity in both the current year and the prior year. The impact is calculated as the difference between (1) reported prior period net revenue (converted to U.S. dollars at historical foreign currency exchange rates) and (2) prior period net revenue converted to U.S. dollars at current period foreign exchange rates.
(2) Net New Business: Estimate of annualized revenue for new wins less annualized revenue for losses incurred in the period.
(3) Adjusted EBITDA: defined as Net income (loss) attributable to Stagwell Inc. common shareholders excluding non-operating income or expense to achieve operating income (loss), plus depreciation and amortization, stock-based compensation, deferred acquisition consideration adjustments, impairment and other losses, and other items. Other items primarily includes restructuring, certain system implementation, working capital administrative fees and acquisition-related expenses. Adjusted EBITDA for our reportable segments is reconciled to Operating Income (Loss), as Net Income (Loss) is not a relevant reportable segment financial metric.
(4) Adjusted Diluted EPS” is defined as (i) Net income (loss) attributable to Stagwell Inc. common shareholders, plus net income (loss) attributable to Class C shareholders, excluding the impact of amortization expense, impairment and other losses, stock-based compensation, deferred acquisition consideration adjustments, discrete tax items, and other items (as defined above), based on total consolidated amounts, then allocated to Stagwell Inc. common shareholders and Class C shareholders, based on their respective income allocation percentage using a normalized effective income tax rate divided by (ii) the diluted weighted average shares outstanding. The diluted weighted average shares outstanding is calculated as (a) the diluted weighted average number of common shares outstanding plus (b) the shares of Class C Common Stock as if converted to shares of Class A Common Stock if not included because they were anti-dilutive.
(5) Free Cash Flow: defined as Net cash provided from operations less normalized capital expenditures and capitalized software. Free Cash Flow Conversion is the percentage of adjusted EBITDA.
Included in this earnings release are tables reconciling reported Stagwell Inc. results to arrive at certain of these non-GAAP financial measures.
This document contains forward-looking statements within the meaning of Section 27A of the Securities Act of 1933, as amended (the “Securities Act”), and Section 21E of the Securities Exchange Act of 1934, as amended (the “Exchange Act”). The Company’s representatives may also make forward-looking statements orally or in writing from time to time. Statements in this document that are not historical facts, including, statements about the Company’s beliefs and expectations, future financial performance, growth, and future prospects, the Company’s strategy, business and economic trends and growth, technological leadership and differentiation, potential and completed acquisitions, anticipated and actual operating efficiencies and synergies and estimates of amounts for redeemable noncontrolling interests and deferred acquisition consideration, constitute forward-looking statements. Forward-looking statements, which are generally denoted by words such as “ability,” “aim,” “anticipate,” “assume,” “believe,” “better,” “build,” “consider,” “continue,” “could,” “develop,” “drive,” “enhance,” “estimate,” “expect,” “focus,” “forecast,” “future,” “grow,” “guidance,” “improve,” “intend,” “likely,” “maintain,” “may,” “ongoing,”, “outlook,” “plan,” “position,” “possible,” “potential,” “probable,” “project,” “seek,” “should,” “target,” “will,” “would” or the negative of such terms or other variations thereof and terms of similar substance used in connection with any discussion of current plans, estimates and projections are subject to change based on a number of factors, including those outlined in this section.
Forward-looking statements in this document are based on certain key expectations and assumptions made by the Company. Although the management of the Company believes that the expectations and assumptions on which such forward-looking statements are based are reasonable, undue reliance should not be placed on the forward-looking statements because the Company can give no assurance that they will prove to be correct. The material assumptions upon which such forward-looking statements are based include, among others, assumptions with respect to general business, economic and market conditions, the competitive environment, anticipated and unanticipated tax consequences and anticipated and unanticipated costs. These forward-looking statements are based on current plans, estimates and projections, and are subject to change based on a number of factors, including those outlined in this section. These forward-looking statements are subject to various risks and uncertainties, many of which are outside the Company’s control. Therefore, you should not place undue reliance on such statements. Forward-looking statements speak only as of the date they are made, and the Company undertakes no obligation to update publicly any of them in light of new information or future events, if any.
Forward-looking statements involve inherent risks and uncertainties. A number of important factors could cause actual results to differ materially from those contained in any forward-looking statements. Such risk factors include, but are not limited to, the following:
risks associated with international, national and regional unfavorable economic conditions, including the effect of changing tariff and other trade policies, inflation and other macroeconomic factors that could affect the Company or its clients;
demand for the Company’s services, which may precipitate or exacerbate other risks and uncertainties;
inflation and actions taken by central banks to counter inflation;
the Company’s ability to attract new clients and retain existing clients;
the impact of a reduction in client spending and changes in client advertising, marketing and corporate communications requirements;
financial failure of the Company’s clients;
the Company’s ability to retain and attract key employees;
the Company’s ability to compete in the markets in which it operates;
the Company’s ability to achieve its cost saving initiatives;
the Company’s implementation of strategic initiatives;
the Company’s ability to remain in compliance with its debt agreements and the Company’s ability to finance its contingent payment obligations when due and payable, including but not limited to those relating to redeemable noncontrolling interests, deferred acquisition consideration and profit interests;
the Company’s ability to manage its growth effectively;
the Company’s ability to identify and complete acquisitions or other strategic transactions that complement and expand the Company’s business capabilities and successfully integrate newly acquired businesses into the Company’s operations, retain key employees, and realize cost savings, synergies and other related anticipated benefits within the expected time period;
the Company’s ability to identify and complete divestitures and to achieve the anticipated benefits therefrom;
the Company’s ability to develop products incorporating new technologies, including augmented reality, artificial intelligence, and virtual reality, and realize benefits from such products;
the Company’s use of artificial intelligence, including generative artificial intelligence;
adverse tax consequences for the Company, its operations and its stockholders, that may differ from the expectations of the Company, including that recent or future changes in tax laws, potential changes to corporate tax rates in the United States and disagreements with tax authorities on the Company’s determinations that may result in increased tax costs;
adverse tax consequences in connection with the business combination that formed the Company in August 2021, including the incurrence of material Canadian federal income tax (including material “emigration tax”);
the Company’s ability to maintain an effective system of internal control over financial reporting, including the risk that the Company’s internal controls will fail to detect misstatements in its financial statements;
the Company’s ability to accurately forecast its future financial performance and provide accurate guidance;
the Company’s ability to protect client data from security incidents or cyberattacks;
economic disruptions resulting from war and other economic and geopolitical tensions (such as the ongoing military conflicts in Iran and the Middle East, and between Russia and Ukraine), terrorist activities, natural disasters, public health events, and tariff and trade policies;
stock price volatility; and
foreign currency fluctuations.
Investors should carefully consider these risks factors, the additional risk factors outlined under the caption “Risk Factors” in this Form 10-K, and in the Company’s other filings with the Securities and Exchange Commission (the”SEC”) which are accessible on the SEC’s website at www.sec.gov.
SCHEDULE 1 STAGWELL INC. UNAUDITED CONSOLIDATED STATEMENTS OF OPERATIONS (amounts in thousands, except per share amounts)
Three Months Ended December 31,
Year Ended December 31,
2025
2024
2025
2024
Revenue
$
807,444
$
788,708
$
2,909,000
$
2,841,216
Operating Expenses
Cost of services
503,718
502,522
1,845,958
1,842,978
Office and general expenses
203,481
203,887
732,326
711,803
Depreciation and amortization
43,614
38,771
171,249
151,652
Impairment and other losses
–
–
466
1,715
750,813
745,180
2,749,999
2,708,148
Operating Income
56,631
43,528
159,001
133,068
Other income (expenses):
Interest expense, net
(24,431
)
(24,038
)
(96,438
)
(92,317
)
Foreign exchange, net
(1,156
)
645
(1,640
)
(1,656
)
Gain (loss) on sale of business
(2,245
)
–
(2,245
)
–
Bargain purchase gain
9,937
–
9,937
–
Other, net
2,314
(547
)
171
(1,372
)
(15,581
)
(23,940
)
(90,215
)
(95,345
)
Income before income taxes and equity in earnings of non-consolidated affiliates
41,050
19,588
68,786
37,723
Income tax expense
24,321
3,741
38,271
13,182
Income before equity in earnings of non-consolidated affiliates
16,729
15,847
30,515
24,541
Equity in income of non-consolidated affiliates
93
–
111
503
Net income
16,822
15,847
30,626
25,044
Net income attributable to noncontrolling and redeemable noncontrolling interests
(4,162
)
(12,612
)
(1,525
)
(22,785
)
Net income attributable to Stagwell Inc. common shareholders
$
12,660
$
3,235
$
29,101
$
2,259
Earnings Per Common Share:
Basic
$
0.05
$
0.03
$
0.13
$
0.02
Diluted
$
0.05
$
0.03
$
0.08
$
0.02
Weighted Average Number of Common Shares Outstanding:
Basic
251,650
109,266
220,608
110,890
Diluted
258,997
115,147
264,523
115,752
SCHEDULE 2 STAGWELL INC. UNAUDITED COMPONENTS OF NET REVENUE CHANGE (amounts in thousands)
Net Revenue – Components of Change
Change
Three Months Ended December 31, 2024
Foreign Currency
Net Acquisitions (Divestitures)
Organic (1)
Total Change
Three Months Ended December 31, 2025
Organic
Total
Marketing Services
$
240,262
$
2,017
$
1,315
$
1,215
$
4,547
$
244,809
0.5
%
1.9
%
Digital Transformation
84,570
(130
)
5,419
2,335
7,624
92,194
2.8
%
9.0
%
Media & Commerce
161,720
1,745
3,154
11,546
16,445
178,165
7.1
%
10.2
%
Communications
131,736
385
–
(23,796
)
(23,411
)
108,325
(18.1
)%
(17.8
)%
The Marketing Cloud
13,122
485
8,706
5,404
14,595
27,717
41.2
%
111.2
%
Corporate, eliminations and other
(1,787
)
–
–
1,410
1,410
(377
)
(78.9
)%
(78.9
)%
$
629,623
$
4,502
$
18,594
$
(1,886
)
$
21,210
$
650,833
(0.3
)%
3.4
%
(1) See Non-GAAP Financial Measures section above for the definition of Organic Net Revenue.
SCHEDULE 3 STAGWELL INC. UNAUDITED COMPONENTS OF NET REVENUE CHANGE (amounts in thousands)
Net Revenue – Components of Change
Change
Year Ended December 31, 2024
Foreign Currency
Net Acquisitions (Divestitures)
Organic (1)
Total Change
Year Ended December 31, 2025
Organic
Total
Marketing Services
$
905,117
$
3,491
$
9,788
$
41,280
$
54,559
$
959,676
4.6
%
6.0
%
Digital Transformation
324,183
(405
)
13,615
29,779
42,989
367,172
9.2
%
13.3
%
Media & Commerce
601,503
3,396
5,829
(708
)
8,517
610,020
(0.1
)%
1.4
%
Communications
435,626
547
29,002
(71,744
)
(42,195
)
393,431
(16.5
)%
(9.7
)%
The Marketing Cloud
32,265
941
62,229
11,051
74,221
106,486
34.3
%
230.0
%
Corporate, eliminations and other
(2,032
)
–
–
(7,082
)
(7,082
)
(9,114
)
NM
NM
$
2,296,662
$
7,970
$
120,463
$
2,576
$
131,009
$
2,427,671
0.1
%
5.7
%
(1) See Non-GAAP Financial Measures section above for the definition of Organic Net Revenue.
SCHEDULE 4 STAGWELL INC. UNAUDITED SEGMENT OPERATING RESULTS (amounts in thousands)
For the Three Months Ended December 31, 2025
Marketing Services
Digital Transformation
Media & Commerce
Communications
The Marketing Cloud
Corporate, Elimination and Other
Total
Net revenue
$
244,809
$
92,194
$
178,165
$
108,325
$
27,717
$
(377
)
$
650,833
Billable costs
50,555
9,117
32,862
64,037
35
5
156,611
Revenue
295,364
101,311
211,027
172,362
27,752
(372
)
807,444
Billable costs
50,555
9,117
32,862
64,037
35
5
156,611
Staff costs
144,258
63,081
93,713
57,083
14,964
17,055
390,154
Administrative costs
20,304
7,668
25,988
13,799
4,243
12,238
84,240
Unbillable and other costs, net
18,103
154
21,000
2,390
5,511
(1
)
47,157
Adjusted EBITDA(1)
62,144
21,291
37,464
35,053
2,999
(29,669
)
129,282
Stock-based compensation
4,647
1,041
1,127
(435
)
87
3,486
9,953
Depreciation and amortization
12,154
5,924
8,637
6,362
6,078
4,459
43,614
Deferred acquisition consideration
–
4,542
68
(2,143
)
(23
)
–
2,444
Impairment and other losses
–
–
–
–
–
–
–
Other items, net(1)
5,996
366
7,437
1,362
1,042
437
16,640
Operating income (loss)
$
39,347
$
9,418
$
20,195
$
29,907
$
(4,185
)
$
(38,051
)
$
56,631
(1) See Non-GAAP Financial Measures section above for the definition of Adjusted EBITDA and Other items, net.
SCHEDULE 5 STAGWELL INC. UNAUDITED SEGMENT OPERATING RESULTS (amounts in thousands)
For the Year Ended December 31, 2025
Marketing Services
Digital Transformation
Media & Commerce
Communications
The Marketing Cloud
Corporate, Elimination and Other
Total
Net revenue
$
959,676
$
367,172
$
610,020
$
393,431
$
106,486
$
(9,114
)
$
2,427,671
Billable costs
175,145
26,327
80,655
199,146
51
5
481,329
Revenue
1,134,821
393,499
690,675
592,577
106,537
(9,109
)
2,909,000
Billable costs
175,145
26,327
80,655
199,146
51
5
481,329
Staff costs
565,484
247,967
363,031
229,356
68,647
52,411
1,526,896
Administrative costs
105,801
27,267
93,003
50,841
17,613
7,938
302,463
Unbillable and other costs, net
78,333
1,305
64,833
9,300
22,689
(1
)
176,459
Adjusted EBITDA(1)
210,058
90,633
89,153
103,934
(2,463
)
(69,462
)
421,853
Stock-based compensation
19,716
4,122
4,191
6,325
628
19,113
54,095
Depreciation and amortization
52,295
23,174
30,263
25,711
23,514
16,292
171,249
Deferred acquisition consideration
(4,784
)
12,271
3,010
(7,022
)
(10,942
)
–
(7,467
)
Impairment and other losses
–
–
–
222
244
–
466
Other items, net(1)
10,228
1,859
17,549
5,048
3,651
6,174
44,509
Operating income (loss)
$
132,603
$
49,207
$
34,140
$
73,650
$
(19,558
)
$
(111,041
)
$
159,001
(1) See Non-GAAP Financial Measures section above for the definition of Adjusted EBITDA and Other items, net.
SCHEDULE 6 STAGWELL INC. UNAUDITED SEGMENT OPERATING RESULTS (amounts in thousands)
For the Three Months Ended December 31, 2024
Marketing Services
Digital Transformation
Media & Commerce
Communications
The Marketing Cloud
Corporate, Elimination and Other
Total
Net revenue
$
240,262
$
84,570
$
161,720
$
131,736
$
13,122
$
(1,787
)
$
629,623
Billable costs
48,294
2,110
11,719
97,372
–
(410
)
159,085
Revenue
288,556
86,680
173,439
229,108
13,122
(2,197
)
788,708
Billable costs
48,294
2,110
11,719
97,372
–
(410
)
159,085
Staff costs
146,876
60,557
91,108
69,381
10,614
11,685
390,221
Administrative costs
25,300
6,102
22,190
13,646
2,725
3,312
73,275
Unbillable and other costs, net
15,458
605
18,944
2,882
2,860
–
40,749
Adjusted EBITDA(1)
52,628
17,306
29,478
45,827
(3,077
)
(16,784
)
125,378
Stock-based compensation
2,093
(1,480
)
1,866
2,254
157
8,345
13,235
Depreciation and amortization
12,680
5,585
7,301
6,556
3,193
3,456
38,771
Deferred acquisition consideration
3,379
4,221
(1,292
)
9,673
(936
)
–
15,045
Other items, net(1)
8,823
201
1,863
1,403
88
2,421
14,799
Operating income (loss)
$
25,653
$
8,779
$
19,740
$
25,941
$
(5,579
)
$
(31,006
)
$
43,528
(1) See Non-GAAP Financial Measures section above for the definition of Adjusted EBITDA and Other items.
SCHEDULE 7 STAGWELL INC. UNAUDITED SEGMENT OPERATING RESULTS (amounts in thousands)
For the Year Ended December 31, 2024
Marketing Services
Digital Transformation
Media & Commerce
Communications
The Marketing Cloud
Corporate, Elimination and Other
Total
Net revenue
$
905,117
$
324,183
$
601,503
$
435,626
$
32,265
$
(2,032
)
$
2,296,662
Billable costs
172,490
11,473
93,899
267,439
–
(747
)
544,554
Revenue
1,077,607
335,656
695,402
703,065
32,265
(2,779
)
2,841,216
Billable costs
172,490
11,473
93,899
267,439
–
(747
)
544,554
Staff costs
557,776
227,522
356,684
232,096
28,686
46,942
1,449,706
Administrative costs
101,145
21,809
83,572
47,335
9,777
11,408
275,046
Unbillable and other costs, net
70,924
1,393
65,188
10,840
6,117
–
154,462
Adjusted EBITDA(1)
175,272
73,459
96,059
145,355
(12,315
)
(60,382
)
417,448
Stock-based compensation
17,095
6,622
6,265
7,721
805
13,653
52,161
Depreciation and amortization
53,106
22,398
31,450
20,100
12,502
12,096
151,652
Deferred acquisition consideration
5,379
7,911
(7,745
)
18,770
(1,320
)
–
22,995
Impairment and other losses
1,500
–
–
–
–
215
1,715
Other items, net(1)
20,251
3,090
17,103
4,860
629
9,924
55,857
Operating income (loss)
$
77,941
$
33,438
$
48,986
$
93,904
$
(24,931
)
$
(96,270
)
$
133,068
(1) See Non-GAAP Financial Measures section above for the definition of Adjusted EBITDA and Other items, net.
SCHEDULE 8 STAGWELL INC. UNAUDITED RECONCILIATION OF ADJUSTED DILUTED EARNINGS PER SHARE (NON-GAAP MEASURE) (amounts in thousands, except per share amounts)
For the Three Months Ended December 31, 2025
GAAP
Adjustments
Non-GAAP
Net income attributable to Stagwell Inc. common shareholders and adjusted net income
$
12,660
$
64,037
$
76,697
Diluted – Weighted average number of shares outstanding
258,997
–
258,997
Diluted EPS and Adjusted Diluted EPS (1)
$
0.05
$
0.30
Adjustments to Net income
Amortization
$
38,333
Stock-based compensation
9,953
Deferred acquisition consideration
2,444
Other items, net
16,639
67,369
Adjusted tax expense
(3,332
)
$
64,037
(1) See Non-GAAP Financial Measures section above for the definition of Adjusted Diluted EPS.
SCHEDULE 9 STAGWELL INC. UNAUDITED RECONCILIATION OF ADJUSTED DILUTED EARNINGS PER SHARE (NON-GAAP MEASURE) (amounts in thousands, except per share amounts)
For the Year Ended December 31, 2025
GAAP
Adjustments
Non-GAAP
Net income attributable to Stagwell Inc. common shareholders
$
29,101
$
198,129
$
227,230
Net loss attributable to Class C shareholders
(6,637
)
–
(6,637
)
Net income attributable to Stagwell Inc. and Class C shareholders and adjusted net income
$
22,464
$
198,129
$
220,593
Diluted – Weighted average number of common shares outstanding
225,468
–
225,468
Weighted average number of shares of Class C Common Stock outstanding
39,055
–
39,055
Diluted – Weighted average number of shares outstanding
264,523
–
264,523
Diluted EPS and Adjusted Diluted EPS (1)
$
0.08
$
0.83
Adjustments to Net Income
Amortization
$
145,506
Impairment and other losses
466
Stock-based compensation
54,095
Deferred acquisition consideration
(7,467
)
Other items, net
46,792
239,392
Adjusted tax expense
(41,263
)
$
198,129
(1) See Non-GAAP Financial Measures section above for the definition of Adjusted Diluted EPS.
SCHEDULE 10 STAGWELL INC. UNAUDITED RECONCILIATION OF ADJUSTED DILUTED EARNINGS PER SHARE (NON-GAAP MEASURE) (amounts in thousands, except per share amounts)
For the Three Months Ended December 31, 2024
GAAP
Adjustments
Non-GAAP
Net income attributable to Stagwell Inc. common shareholders
$
3,235
$
22,778
$
26,013
Net income attributable to Class C shareholders
–
41,549
41,549
Net income attributable to Stagwell Inc. and Class C and adjusted net income
$
3,235
$
64,327
$
67,562
Diluted – Weighted average number of common shares outstanding
115,147
–
115,147
Weighted average number of shares of Class C Common Stock outstanding
–
151,649
151,649
Diluted – Weighted average number of shares outstanding
115,147
151,649
266,796
Diluted EPS and Adjusted Diluted EPS (1)
$
0.03
$
0.25
Adjustments to Net income
Amortization
$
30,572
Stock-based compensation
13,235
Deferred acquisition consideration
15,045
Other items, net
14,799
73,651
Adjusted tax expense
(20,618
)
53,033
Net income attributable to Class C shareholders
11,294
$
64,327
Allocation of adjustments to Net income
Net income attributable to Stagwell Inc. common shareholders
$
22,778
Net income attributable to Class C shareholders – add-backs
30,255
Net income attributable to Class C shareholders
11,294
41,549
$
64,327
(1) See Non-GAAP Financial Measures section above for the definition of Adjusted Diluted EPS.
SCHEDULE 11 STAGWELL INC. UNAUDITED RECONCILIATION OF ADJUSTED DILUTED EARNINGS PER SHARE (NON-GAAP MEASURE) (amounts in thousands, except per share amounts)
For the Year Ended December 31, 2024
GAAP
Adjustments
Non-GAAP
Net income attributable to Stagwell Inc. common shareholders
$
2,259
$
82,506
$
84,765
Net income attributable to Class C shareholders
–
126,735
126,735
Net income attributable to Stagwell Inc. and Class C shareholders and adjusted net income
$
2,259
$
209,241
$
211,500
Diluted – Weighted average number of common shares outstanding
115,752
–
115,752
Weighted average number of shares of Class C Common Stock outstanding
–
151,649
151,649
Diluted – Weighted average number of shares outstanding
115,752
151,649
267,401
Diluted EPS and Adjusted Diluted EPS (1)
$
0.02
$
0.79
Adjustments to Net income
Amortization
$
122,442
Impairment and other losses
1,715
Stock-based compensation
52,161
Deferred acquisition consideration
22,995
Other items, net
55,857
255,170
Adjusted tax expense
(63,073
)
192,097
Net income attributable to Class C shareholders
17,144
$
209,241
Allocation of adjustments to Net income
Net income attributable to Stagwell Inc. common shareholders
$
82,506
Net income attributable to Class C shareholders – add-backs
109,591
Net income attributable to Class C shareholders
17,144
126,735
$
209,241
(1) See Non-GAAP Financial Measures section above for the definition of Adjusted Diluted EPS.
SCHEDULE 12 STAGWELL INC. UNAUDITED CONSOLIDATED BALANCE SHEETS (amounts in thousands)
December 31, 2025
December 31, 2024
ASSETS
Current Assets
Cash and cash equivalents
$
104,537
$
131,339
Accounts receivable, net
735,752
716,415
Expenditures billable to clients
164,694
173,194
Other current assets
157,309
114,200
Total Current Assets
1,162,292
1,135,148
Fixed assets, net
73,081
72,706
Right-of-use assets – operating leases
213,576
219,400
Goodwill
1,595,238
1,554,146
Other intangible assets, net
834,248
836,783
Deferred tax assets
281,057
46,926
Other assets
55,055
43,112
Total Assets
$
4,214,547
$
3,908,221
LIABILITIES, REDEEMABLE NONCONTROLLING INTERESTS (“RNCI”), AND SHAREHOLDERS’ EQUITY
Current Liabilities
Accounts payable
$
548,320
$
449,347
Accrued media
239,490
245,883
Accruals and other liabilities
291,554
265,356
Advance billings
329,815
294,609
Current portion of lease liabilities – operating leases
55,386
60,195
Current portion of deferred acquisition consideration
15,446
51,906
Total Current Liabilities
1,480,011
1,367,296
Long-term debt
1,326,013
1,353,624
Long-term portion of deferred acquisition consideration
24,598
50,209
Long-term lease liabilities – operating leases
224,397
245,397
Deferred tax liabilities
54,726
47,239
Long-term tax receivable agreement liability
252,390
25,493
Other liabilities
51,077
33,646
Total Liabilities
3,413,212
3,122,904
Redeemable Noncontrolling Interests
24,968
8,412
Commitments, Contingencies and Guarantees
Shareholders’ Equity
Common shares – Class A
252
115
Common shares – Class C
–
2
Paid-in capital
744,463
343,647
Retained earnings
32,930
11,740
Accumulated other comprehensive loss
(19,252
)
(23,773
)
Stagwell Inc. Shareholders’ Equity
758,393
331,731
Noncontrolling interests
17,974
445,174
Total Shareholders’ Equity
776,367
776,905
Total Liabilities, Redeemable Noncontrolling Interests and Shareholders’ Equity
$
4,214,547
$
3,908,221
SCHEDULE 13 STAGWELL INC. UNAUDITED SUMMARY CASH FLOW DATA (amounts in thousands)
Years Ended December 31,
2025
2024
Cash flows from operating activities:
Net income
$
30,626
$
25,044
Adjustments to reconcile net income to cash provided by operating activities:
Stock-based compensation
54,095
52,161
Depreciation and amortization
171,249
151,652
Amortization of right-of-use lease assets and lease liability interest
67,495
75,117
Impairment and other (gains) losses
(3,116
)
1,715
Deferred income taxes
10,439
(10,686
)
Adjustment to deferred acquisition consideration
(7,467
)
23,005
Loss (gain) on sale of business
2,245
–
Bargain purchase gain
(9,937
)
–
Other, net
7,519
7,622
Changes in working capital:
Accounts receivable
28,787
8,465
Expenditures billable to clients
12,012
(54,350
)
Other current assets
(51,534
)
(6,200
)
Accounts payable
73,573
24,438
Accrued expenses and other liabilities
(42,244
)
(28,658
)
Advance billings
25,574
(22,651
)
Current portion of lease liabilities – operating leases
(76,465
)
(83,905
)
Deferred acquisition related payments
(1,823
)
(19,910
)
Net cash provided by operating activities
291,028
142,859
Cash flows from investing activities:
Capitalized software
(67,489
)
(35,094
)
Capital expenditures
(43,741
)
(18,912
)
Acquisitions, net of cash acquired
(6,179
)
(103,254
)
Proceeds from sale of business, net
10,850
–
Other
(7,119
)
(5,212
)
Net cash used in investing activities
(113,678
)
(162,472
)
Cash flows from financing activities:
Repayment of borrowings under revolving credit facility
(2,026,000
)
(1,755,000
)
Proceeds from borrowings under revolving credit facility
1,999,326
1,960,000
Shares repurchased and cancelled
(134,261
)
(108,249
)
Distributions to noncontrolling interests
(9,662
)
(26,723
)
Payment of deferred consideration
(33,343
)
(29,774
)
Purchase of noncontrolling interest
–
(3,316
)
Debt financing and other costs
(6,077
)
–
Net cash (used in) provided by financing activities
(210,017
)
36,938
Effect of exchange rate changes on cash and cash equivalents
5,865
(5,723
)
Net increase (decrease) in cash and cash equivalents
ESTERO, FL / ACCESS Newswire / March 10, 2026 / Aspire Biopharma Holdings, Inc. (Nasdaq:ASBP) (“Aspire”), today announced that its subsidiary, Buzz Bomb Caffeine Company, is expanding its retail footprint with the launch of the BUZZ BOMB™ Convenience Store Pack.
Convenience stores are where many of today’s quick decisions happen, and the checkout counter plays a big role in those moments. By introducing BUZZ BOMB™ into that space, we are giving the consumer greater choice and making BUZZ BOMB™ easier to enjoy and more accessible. This expansion is part of Buzz Bomb Caffeine Company’s broader strategy to evolve with people’s needs, energize convenience retail and drive growth across the caffeine category.
The Lineup
The lineup includes the newly designed six-count “Fruit Blast” package containing two each of the following flavors: Tropical Fruit, Mixed Berry, and Peach Mango, allowing for packaging options that fit changing habits.
BUZZ BOMB™ Convenience Store Pack
The Caffeine Evolution: No Liquid, No Limits BUZZ BOMB™ is a fast-acting dry powder delivered in a single-serving stick pack designed to be sprinkled directly under the tongue. Unlike traditional energy drinks or pills, this serving method allows for a rapid caffeine boost without the need for water, mixing, or consuming large volumes of liquid.
Key Product Highlights:
Precision Dosing: Each stick pack delivers 50mg serving of caffeine.
Ultimate Portability: Slim, light, single-serving packs fit easily into pockets, gym bags, or car consoles.
Six pack “Fruit Blast” Offering: Featuring two each of the following flavors: Tropical Fruit, Mixed Berry, and Peach Mango.
Clean Energy: Ideal for athletes, professionals, and students seeking a quick, affordable alternative to coffee or soda.
“We are redefining how the world consumes caffeine,” said Kraig Higginson, Interim CEO of Aspire Biopharma. “By moving into the convenience store sector, we are meeting our customers exactly where they need us-on the go, providing a precise, flavored caffeine hit that we believe works faster than a beverage.”
The BUZZ BOMB™ Convenience Store Packs will begin appearing on shelves in select locations starting in May.
BUZZ BOMB™ Caffeine Products
Unlike traditional energy drinks or pills, BUZZ BOMB™ is a new and exciting caffeine product delivered in a single-serving stick pack of dry powder sprinkled under the tongue. This method provides flavored caffeine quickly without the hassle of mixing with water or consuming typical caffeine sources like energy drinks, coffee, or soda.
BUZZ BOMB™ features 50mg of caffeine and is currently offered in four delicious flavors: Tropical Fruit, Mixed Berry, Peach Mango, and Coffee Mocha. Designed for athletes, professionals, and the everyday person needing a rapid boost, BUZZ BOMB™ provides a precise serving of caffeine in easy-to-use single serving stick packs.
To learn more about BUZZ BOMB™, or purchase product online, please visit https://buzzbombcaffeine.com or follows us on social media here:
This press release contains “forward-looking statements” within the meaning of Section 21E of the Securities Exchange Act of 1934, as amended, and Section 27A of the Securities Act of 1933, as amended, which are intended to be covered by the “safe harbor” provisions created by those laws. Aspire’s forward-looking statements include, but are not limited to, statements regarding our or our management team’s expectations, hopes, beliefs, intentions or strategies regarding our future operations. In addition, any statements that refer to projections, forecasts or other characterizations of future events or circumstances, including any underlying assumptions, are forward-looking statements. The words “anticipate,” “believe,” “contemplate,” “continue,” “estimate,” “expect,” “intends,” “may,” “might,” “plan,” “possible,” “potential,” “predict,” “project,” “should,” “will,” “would,” and similar expressions may identify forward-looking statements, but the absence of these words does not mean that a statement is not forward-looking. These forward-looking statements represent our views as of the date of this press release and involve a number of judgments, risks and uncertainties. We anticipate that subsequent events and developments will cause our views to change. We undertake no obligation to update forward-looking statements to reflect events or circumstances after the date they were made, whether as a result of new information, future events or otherwise, except as may be required under applicable securities laws. Accordingly, forward-looking statements should not be relied upon as representing our views as of any subsequent date. As a result of a number of known and unknown risks and uncertainties, our actual results or performance may be materially different from those expressed or implied by these forward-looking statements. Some factors that could cause actual results to differ in our drug or supplement offerings include general market conditions, whether clinical trials demonstrate the efficacy and safety of our drug candidates to the satisfaction of regulatory authorities, or do not otherwise produce positive results which may cause us to incur additional costs or experience delays in completing, or ultimately be unable to complete the development and commercialization of our drug candidates; the clinical results for our drug candidates, which may not support further development or marketing approval; actions of regulatory agencies, which may affect the initiation, timing and progress of clinical trials and marketing approval; our ability to achieve commercial success for our drug or supplement candidates, if approved; our limited operating history and our ability to obtain additional funding for operations and to complete the development and commercialization of our product candidates, and other risks and uncertainties set forth in “Risk Factors” in our most recent Annual Report on Form 10-K and any subsequent Quarterly Reports on Form 10-Q. In addition, statements that “we believe” and similar statements reflect our beliefs and opinions on the relevant subject. These statements are based upon information available to us as of the date of this press release, and while we believe such information forms a reasonable basis for such statements, such information may be limited or incomplete, and our statements should not be read to indicate that we have conducted an exhaustive inquiry into, or review of, all potentially available relevant information. These statements are inherently uncertain, and you are cautioned not to rely unduly upon these statements. All information in this press release is as of the date of this press release. The information contained in any website referenced herein is not, and shall not be deemed to be, part of or incorporated into this press release.
AI-Powered Event Management Platform Sees Rapid Enterprise Adoption as Global Organizations Deploy Nextech3D.ai’s Eventdex, Map D and Krafty Labs Solutions for In-Person, Hybrid and Virtual Events
TORONTO, ON / ACCESS Newswire / March 10, 2026 / Nextech3D.ai Corp. (CSE:NTAR)(OTCQB:NEXCF)(FRA:1SS) (“Nextech3D.ai” or the “Company“), a technology leader in AI-powered event technology and immersive digital solutions, today announced that since January 2026 to date it has secured 50 contracts from NEW customers with a total contracted value of approximately $230K. In addition to signing substantially more customers, Nextech3D.ai is also securing larger contracts, with the average deal size increasing 73%, rising from $2,641 in 2025 to $4,578 in 2026.
Importantly, this figure reflects only new customer acquisition and does not include contract renewals or expansion revenue from existing clients, which remain a separate and robust component of the Company’s overall revenue base. The results highlight accelerating adoption of Nextech3D.ai’s AI-driven event and engagement platform among first-time customers across enterprise, education, and government-related markets.
50 New Customer Contracts in Early 2026 Nextech3D.ai secured 50 contracts from first-time customers since January 2026, demonstrating accelerating market adoption of its AI-powered event technology platform.
$230,000 in New Customer Revenue The contracts represent approximately $230,000 in new customer deal value, generated exclusively from new client acquisitions and excluding renewals or expansion revenue from existing customers.
$4,600 Average Contract Value Average contract value reached approximately $4,600 per new customer.
In addition to signing substantially more customers, Nextech3D.ai is also securing larger contracts, with the average deal size increasing 73%, rising from $2,641 in 2025 to $4,578 in 2026.
These metrics highlight both stronger demand for the Company’s platform and increasing adoption of higher-value solutions by new customers.
The comparison period referenced is January to March 2025, which represents a full fiscal quarter, while the 2026 results reflect performance from January 2026 to date, representing an incomplete quarter.
Management believes the Company’s continued growth in new customer acquisition reflects increasing demand for its event technology platform across a range of industries including enterprise, consulting, government contracting, education, and professional organizations. Contract values may vary depending on event size, platform usage, and additional services.
CEO Commentary
“This strong start to 2026 reflects the accelerating demand for AI-powered event technology and enterprise event management platforms,” said Evan Gappelberg, CEO of Nextech3D.ai.
“We are converting a rapidly expanding pipeline into signed contracts while increasing our average deal size and onboarding globally recognized organizations such as Google, Microsoft, Deloitte, and General Dynamics. With our expanding AI platform capabilities and the integration of Eventdex, Map D, and Krafty Labs, we believe Nextech3D.ai is entering a new phase of scalable enterprise growth.”
Management believes these results signal growing momentum across Nextech3D.ai’s enterprise sales pipeline, as Fortune 1000 companies increasingly adopt AI-powered event management platforms to streamline event logistics, increase engagement, and deliver measurable ROI.
The Company remains focused on expanding its global customer base, strengthening enterprise relationships, and continuing to scale its AI-powered event technology platform worldwide.
ABOUT NEXTECH3D.ai
Nextech3D.ai (OTCQB:NEXCF)(CSE:NTAR)(FSE:1SS) is an AI‑powered technology company specializing in AI event solutions, enterprise engagement platforms, 3D modeling, and spatial computing. Through its Eventdex, Map D, and Krafty Labs platforms, the Company delivers registration systems, ticketing, interactive mapping, engagement tools, and analytics for virtual, hybrid, and in‑person events serving Fortune 500 enterprise customers worldwide.
This press release contains forward‑looking statements within the meaning of applicable Canadian securities laws. Forward‑looking statements include, but are not limited to, statements regarding market expansion, entry into new event verticals, pricing adjustments, operating performance, revenue opportunities, and the Company’s path toward profitability. Forward‑looking statements are based on management’s current expectations and assumptions and are subject to known and unknown risks, uncertainties, and other factors that may cause actual results to differ materially. Readers are cautioned not to place undue reliance on forward‑looking statements. The Company undertakes no obligation to update forward‑looking statements except as required by law.
LAS VEGAS, NV / ACCESS Newswire / March 10, 2026 / Arrive AI, a leader in autonomous delivery infrastructure, will showcase the Arrive Point™ Network at the HIMSS Global Health Conference & Exhibition this week, inviting healthcare innovators to rethink what it truly takes to achieve autonomous logistics inside hospitals and healthcare systems.
Visitors can find Arrive AI at Booth #12122 on the Artificial Intelligence Trail, Venetian Level 1, where the company will highlight how healthcare organizations already investing in robotics can unlock the full potential of automation.
The message is simple:
Have Robots? You’re only halfway there.
Hospitals across the country are deploying autonomous robots to move medications, lab samples, and medical supplies. But many health systems quickly discover a critical gap in the automation chain.
Robots can move items. But handoffs break automation.
Without secure transfer infrastructure, robots still rely on people to receive, verify, and manage deliveries – introducing delays, risk, and labor costs back into the process.
The Arrive Point™ Network solves the handoff, creating a secure, unattended transfer system that enables hospitals to operate a true autonomous delivery network.
“The key to scaling autonomy isn’t just the robot,” said Dan O’Toole, Founder and CEO of Arrive AI. “It’s mastering the moment of transfer. That’s where risk, delay, and liability concentrate. Our infrastructure ensures deliveries are secure, verified, and accessible exactly when they’re needed.”
Healthcare logistics often involves time-sensitive and irreplaceable materials, including lab specimens, medications, and surgical supplies. When delivery depends on perfect timing between humans and machines, systems break down.
Autonomy needs infrastructure. Arrive AI provides it.
The Arrive Point™ Network is designed to enable:
Speed Continuous autonomous transport eliminates waiting, batching, and manual handoffs.
Savings Nurses and medical assistants spend valuable time walking materials across campus instead of caring for patients.
Security Sensitive materials like lab samples, medications, and critical supplies require verified chain-of-custody transfers.
Unattended Operation Hospitals experimenting with robotics often still rely on people for deliveries. The Arrive Point™ enables secure, unattended transfer between people, robots, and drones.
For healthcare leaders already exploring robotics, autonomous vehicles, or AI-enabled logistics, Arrive AI offers the missing infrastructure layer that makes hospital-scale autonomy possible.
Visit Arrive AI at HIMSS
Venetian Level 1 The Artificial Intelligence Trail Booth #12122
Conference attendees are invited to stop by the booth to learn how the Arrive Point™ Network can transform hospital logistics into a fully autonomous, secure delivery ecosystem.
About Arrive AI
Arrive AI (NASDAQ:ARAI) is an autonomous delivery infrastructure company specializing in patented AI-powered smart receptacles called Arrive Points™. These secure, climate-assisted smart mailboxes enable fully asynchronous handoffs between robots, drones, couriers, and end users. Arrive AI’s Autonomous Last Mile (ALM) platform provides tracking, smart logistics alerts, and advanced chain-of-custody controls, forming the backbone of next-generation autonomous delivery networks. Learn more at www.arriveai.com.
This news release and statements of Arrive AI’s management in connection with this news release or related events contain or may contain “forward-looking statements” within the meaning of Section 21E of the Securities Exchange Act of 1934, as amended, and the Private Securities Litigation Reform Act of 1995. In this context, forward-looking statements mean statements, including but not limited to, statements related to future events, which may impact our expected future business and financial performance, and often contain words such as “expects”, “anticipates”, “intends”, “plans”, “believes”, “potential”, “will”, “should”, “could”, “would”, “optimistic” or “may” and other words of similar meaning. These forward-looking statements are based on information available to us as of the date of this news release and represent management’s current views and assumptions. Forward-looking statements are not guarantees of future performance, events or results and involve significant known and unknown risks, uncertainties and other factors which may be beyond our control. Readers are cautioned not to place undue reliance on these forward-looking statements, which apply only as of the date of this news release. Potential investors should review Arrive AI’s filings with the United States Securities and Exchange Commission for more complete information, including the risk factors that may affect future results, which are available for review at www.sec.gov (http://www.sec.gov/). Accordingly, forward-looking statements should not be relied upon as a predictor of actual results. We do not undertake to update our forward-looking statements to reflect events or circumstances that may arise after the date of this news release, except as required by law.
Partnership unlocks access to one of the world’s most powerful mobile platforms, enabling Stagwell clients to reach audiences with greater precision and efficiency
NEW YORK CITY, NY / ACCESS Newswire / March 10, 2026 / Stagwell (NASDAQ:STGW), the global challenger network transforming marketing through AI, today announced a strategic partnership with AppLovin that brings AppLovin’s advanced mobile advertising platform, Axon, into Stagwell’s media offering, providing clients with enhanced transparency, measurement, and reporting tools for smarter, highly effective mobile campaigns.
Axon by AppLovin is a leading mobile marketing platform, reaching over a billion users every day across mobile apps and connected TV. With a large network of top-ranked gaming apps and a proprietary AI engine for real-time ad optimization, it is one of the most influential platforms in mobile and performance advertising. Through the partnership, Stagwell clients will gain access to a billion potential customers that are highly engaged inside mobile games.
“AppLovin’s platform offers powerful reach and performance capabilities for our clients looking to drive measurable outcomes in mobile environments,” said Mark Penn, Chairman and CEO of Stagwell. “This partnership aligns with Stagwell’s broader focus on AI-powered marketing, pairing its performance-driven approach with AppLovin’s machine learning-driven platform.”
In addition to enhanced reporting and optimization tools, Stagwell clients will also receive platform support across setup and optimization, creative best practices, and vertical-specific campaign execution. These resources will help clients get the most out of the platform and deepen AppLovin’s engagement with global brands and agencies across Stagwell’s network. Looking ahead, the companies also plan to collaborate on future joint marketing initiatives and industry events.
About Stagwell Stagwell is the global challenger network transforming marketing through AI. We deliver scaled creative performance for the world’s most ambitious brands, connecting culture-moving creativity with leading-edge technology to harmonize the art and science of marketing. Led by entrepreneurs, our specialists in 45+ countries are unified under a single purpose: to drive effectiveness and improve business results for our clients. Join us at www.stagwellglobal.com.